 How widespread an impact would the failure of a deep sea oil well in New Zealand waters have on coastlines and fishing grounds?
A report attempting to answer this question, commissioned by Greenpeace NZ from data modelling firm Dumpark, has been released today.
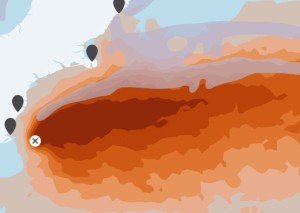
It models the potential spread of a major deep sea oil spill in offshore areas of New Zealand waters where prospecting activities are scheduled to begin this summer (Taranaki and Canterbury basins).
A copy of the modelling report can be downloaded from this interactive website.
We asked experts: does the report describe a realistic deep sea well failure scenario? How credible are the underlying assumptions? Have the modelling tools been appropriately applied?
The Science Media Centre has rounded up the following comments on the report from independent experts in oceanography, petroleum engineering and modelling.
Dr Ross Vennell, Physical oceanographer, Department of Marine Science, University of Otago, comments:
“This report predicts how far a major oil spill from two NZ deep water sites is likely to spread. The computer model predictions are for spills on the scale of the 2010 Deep Horizon disaster in the Gulf of Mexico and smaller. The oil spill predictions use models developed by the US National Oceanic and Atmospheric Administration (NOAA), using freely-available wind and current data from a global ocean computer model to estimate the spread of the oil by wind, waves and currents. The report models virtual oil spills starting at many different times during a 10 year period to estimate the areas which the oil is likely to spread to.
“In one way, the virtual oil spill scenarios are conservative. Only a 76 day-long spill was used for the worst case scenario of a rogue well which requires a new drilling rig to be brought to NZ and a new well sunk to stop the oil spilling. This optimistic time frame means less oil is spilt than in the Gulf disaster, where it took 152 days to drill a new well.
“In another way, the scenarios appear much less conservative, by assuming that all the oil is released at the sea surface. In the Gulf, oil was released from a pipe at the sea bed. Probably less than half the spilt oil in the Gulf reached the sea surface to form oil slicks, the remainder forming deep plumes of oil-contaminated water.
“On balance, the predicted extent of the areas affected by spilt oil are likely reasonable for the worst case of an oil rig disaster where safety valves at the sea bed fail to work, as occurred in the Gulf. We obviously don’t know the exact chances of a oil rig disaster followed by a valve failure in NZ waters, nor the likely volume of spilt oil from the two NZ sites.
“The ocean current data used to estimate oil spread only has data approximately every 5km-10km. Thus the current data is more useful in predicting the spread of oil in water more than 100m deep, but the detailed predictions are less reliable near the coast.
“However, the predictions appear to be a reasonable first attempt to estimate the extent of a worst case spill from deepwater sites in NZ. It would require more work to clarify and expand on these predictions.”
Prof Rosalind Archer, Head of Department of Engineering Science, University of Auckland, comments:
“In the scenarios used to model a potential blowout, the assumptions made about the flow rate that could occur from the well are very significant.
“It is important to ensure that any wells used as analogies are from reservoirs with similar depth, pressure, permeability etc. as the areas being considered. The text of the report does not make it clear whether the Taranga-1, Arawa-1 and Kanuka-1 wells are good analogs because those points are not discussed. The report gives no evidence that 40,000 barrels per day spill rate [the largest of the rates modelled] is reasonable for a New Zealand well. The report does point out that one of the Maari wells tested at 20,000 barrels per day instantaneously. However, rates will normally decline as the well flows, i.e. over the 76 day window considered.
“The report appears to assume that nothing is done to constrain the well rate, or the area of the ocean affected, over the 76 days. I would anticipate that during that time window control strategies such as booms, dispersants etc. would be used, and that these would have some impact on growth of the spill area.
“Given my comments above, my assessment is that this report is likely to overstate the impact of a possible blow out in New Zealand waters.”
Dr Willem de Lange, Department of Earth and Ocean Sciences, Faculty of Science and Engineering, University of Waikato, comments:
“The study uses industry-standard modeling approaches to simulate possible outcomes from two deep-sea exploration well oil leaks, for different wind and current climatologies. The results are presented in terms of the probabilities of exposure to oil from each spill, and interpreted in terms of the surface concentration relative to thresholds of impact. The simulations are limited by the lack of NZ specific data and high-resolution wind and current data, and indicate general patterns and not the outcome of a particular spill event.
“There is no analysis of the likelihood of the scenarios being modeled actually occurring.
“The assumptions underlying the scenarios are based on past events outside New Zealand. The report indicates that flow rates for New Zealand are likely to be lower than occurred for international exploration well leaks. The report is primarily based on the upper end of the estimated range for New Zealand flow rates (5-10,000 barrels per day).
“There are key assumptions about the nature of the failure resulting in the leak, and hence the type of response required. These define the duration of the spill and, hence, combined with the flow rate determine the total volume spilled. The assumptions are described as ‘optimistic’ *, which seems to imply they define the minimum spill duration and volume. Whether they are realistic will depend on what actually occurs, and the location and availability of necessary equipment at the time.
“The other assumptions relate mostly to the dispersal and impact of the oil spills. These assumptions appear generally reasonable, but overall their impact on the outcome is relatively minor comparing to those determining the total spill volume.
“The report uses standard tools developed for modeling of oil spill scenarios. However, the data used to drive the models is derived from relatively low-resolution global models of ocean currents and winds. These models were used to derive the climatologies for the random model runs.
“Our evaluation of the Rena oil spill simulations indicates that the wind velocity data were the most important determinant of the oil spill trajectory. The data used for this study are not ideal for assessing the oils spill trajectories, particularly close to the coast. The same caveat applies to the current data closer to the coast, but this has less impact on the outcome. Since, the report is concerned about beaching effects, it would be better to use higher resolution, preferably observational, data for coastal regions.
“The study is a reasonable and credible assessment of the potential impacts of the scenarios modelled. There is, however, no risk analysis of the likelihood of these events occurring, and, hence, the risks are not portrayed.
“The report describes the probability distributions for oil spill coverage resulting from two potential deep-sea well failure scenarios for different sedimentary basins. The assumptions made are reasonable and within the range of observed events outside New Zealand. Actual events that are consistent with the modeling parameters are likely to produce an oil spill that lies within the distributions plotted. However, no single event will cover the entire area shown to be potentially affected.”
*Refers to a previous draft of the report. In the final version, the word “optimistic” has been removed.