The Ministry for the Environment has issued its latest Greenhouse Gas Inventory (1990-2012) and Net Position — the official annual report of human caused emissions of greenhouse gases in New Zealand.
 The inventory is produced each year as part of New Zealand’s obligations under the United Nations Framework Convention on Climate Change (UNFCCC) and the Kyoto Protocol.
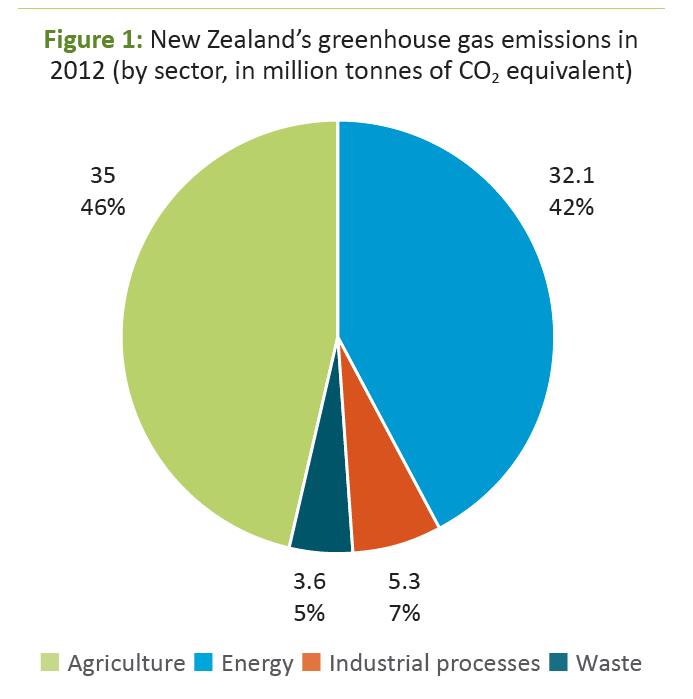
The report reveals that in 2012, New Zealand’s total greenhouse gas emissions were 76.0 million tonnes of carbon dioxide equivalent (Mt CO2-e) – 25% higher than 1990 levels. The four emission sources that contributed the most to this increase in total emissions were dairy enteric fermentation, road transport, agricultural soils, and consumption of hydrofluorcarbons.
Over the five year period 2008-2012, New Zealand’s total greenhouse gas emissions were 372.8 Mt CO2-e. These emissions were partially offset by 71.6 Mt CO2-e of sequestration from forestry. Therefore New Zealand’s net emissions over the first Kyoto Protocol commitment period were 301.2 Mt CO2-e, which was 8.4 Mt CO2-e below New Zealand’s Kyoto target.
The SMC collected the following expert commentary. Feel free to use these quotes in your reporting. If you would like to contact a New Zealand expert, please contact the SMC (04 499 5476; smc@sciencemediacentre.co.nz).
Professor Martin Manning, Climate Change Research Institute Victoria University of Wellington, comments:
“The Ministry for the Environment 2014 report is making it quite clear that, while New Zealand is meeting its requirements under the Kyoto Protocol, we are not reducing our greenhouse gas emissions as required globally to keep warming below 2°C.
“This is shown by the report first noting that our total emissions in 2012 had increased by 25% since 1990, and then following that with figures for a decrease in the net emissions that include offsets due to forestry as used in the Kyoto Protocol. When considering the longer term UNFCCC goal of limiting global warming to 2°C, achieving the Kyoto Protocol target can be quite misleading because it compares net emissions over the first commitment period, 2008 – 2012, with the gross emissions in 1990.
“If one compares the net emissions in 2012 with those for 1990, then the increase in NZ has actually been more than 100%. But this is showing that offsets from forestry fluctuate significantly and so, while important, they play a limited role for stabilising our climate.
“The MfE report also notes that agricultural emissions increased over 2009 – 2012 due to more export of dairy products. However, the longer term trend shows our CO2 emissions are increasing by more than those of methane and nitrous oxide from agriculture. To achieve the UNFCCC target of 2°C it is essential that this trend be reversed, because substantial reductions in CO2 emissions are more important than changes in the other greenhouse gases.”
Associate Prof, James Renwick, School of Geography, Environment and Earth Sciences, Victoria University of Wellington
“Latest figures from MfE show New Zealand’s greenhouse gas emissions have risen 25% since 1990, and rose over 2% in just one year, between 2011 and 2012. We currently emit over 16 tons of CO2-equivalent per person, when the globally sustainable rate is around 1 ton per person. The government is suggesting a 10% reduction in emissions compared to 1990, by 2020 – that would be a 35% reduction from today’s emission rates in 6 years, quite some feat. What is the present government doing? Opening up potential fossil fuel reserves to new prospecting, and building a lot more roads. There is a huge gulf between the ‘talk’ and the ‘walk’. Meanwhile, climate changes continue to accumulate. I hope New Zealand and the nations of the world start taking this problem seriously, seize the opportunities and mitigate the risks, before the costs become unbearable.”
Prof Dave Frame, Director of Climate Change Research Institute, Victoria University of Wellington, comments:
“In per capita terms since 1990 New Zealand’s emissions have fallen by about 5%, which is comparable to many Western European countries. Europe has various tailwinds on this issue, such as declining oil and gas production from the North Sea, macroeconomic trends from manufacturing towards services, and lots of easy changes after the fall of the Berlin Wall. That’s why they like 1990 as a baseline year. By contrast, New Zealand has various headwinds: a large, pre-existing renewable electricity sector, a growing vehicle fleet, and relatively high population growth. There is a lot of ‘national circumstance’ hidden behind raw numbers; it’s a bit silly to compare the numbers without comparing the circumstances.”
Dr Jim Salinger, climate scientist, comments:
“The 25 per cent increase in New Zealand’s greenhouse gas emissions shows the shocking performance by the country in reducing the emissions to a warming world. New Zealand is very much contributing to the ‘Business as Usual’ pathway of warming of 3.5 to 4°C by 2100 AD, and 1 metre or more sea level rise. Two sectors that are contributing significantly are the rapid increase in dairy farming, and the continual expansion of the road transport sector. For the former the 16 billion litres of milk production results in 15 billion kilograms of carbon dioxide equivalent emissions. The opportunity here is to help animals digest their feed better, to produce fewer emissions with more energy to help close the nutrient cycle. For the latter New Zealand must embark on rapid improvement to public transport networks especially in Auckland, rather than the emphasis on roads and motorways, and the introduction of private transport based on renewable energy. This will require a turnaround in current government transport policy.”
Professor Euan Mason, School of Forestry, University of Canterbury comments:
“The inventory makes grim reading. Our emissions per capita are the fifth highest in the world, and as the report notes, emissions from deforestation began to accelerate in 2011 and our overall emissions are not being reduced. Deforestation resumed when we began to import large numbers of cheap, ‘hot air’ credits in 2011.
“We met our target for the first Kyoto commitment period between 2008 and 2012, but that was a very soft target; to set our net greenhouse gas (GHG) emissions to what our gross emissions were in 1990. Had we been required to reduce our net emissions to 1990 net emissions or our gross emissions to 1990 gross emissions then we would have failed by a very large margin. This is clear from the graphs presented in the Greenhouse Gas Inventory.
‘The report states that, ‘New Zealand has fewer low-cost options to reduce emissions compared with most other developed countries, with three-quarters of electricity generated from renewable energy, a growing and dispersed population, and around half of its emissions from agriculture.’, but this statement is arguably false. Other countries have taken more strides than we have to generate total energy from renewables, such as Sweden’s 50% versus New Zealand’s 35%. Moreover, with a relatively inexpensive programme of afforestation on marginal lands we could very much reduce our net emissions while solving erosion problems and reducing damage from floods. In fact we easily could go much further and become completely GHG neutral for between 60 and 100 years by planting a further 9% of our land area in forest. This could be done on marginal land; without destocking our farms.
“We have withdrawn from Kyoto’s second commitment period. It is clear that had we remained in the Kyoto process then we would have failed to meet our future commitments, especially because harvesting of forests planted during the 1990s planting boom will see our net position sharply deteriorate during the 2020s. In order to forestall this deterioration we need to have an effective ETS with New Zealand Unit (our domestic carbon credit, NZU) prices more in the $20 range (current range is ~ $3/credit). The forestry sector has lost interest in the ETS because NZU prices are too low.
“New Zealand’s climate change response lacks policy settings that would make our Emissions Trading Scheme actually work. The current price of NZUs is just over $3. Imported Emission Reduction Unit (ERU, ‘Hot Air’) credits are worth just 19 cents. 82% of surrendered credits in our ETS were ‘hot air’ ERUs last year while less than 2% were NZUs. New Zealand’s emitters can surrender ERUs to ‘offset’ their emissions, while hoarding or selling higher priced NZUs that we taxpayers have given them to account for ‘allowed emissions’. Grandfathering of credits allows for 50% of energy-related emissions, and 90% of ‘trade-exposed’ enterprises’ emissions. The latter includes companies such as Rio Tinto. The net worth of grandfathered NZUs that are replaced by imported ERUs runs into many millions of dollars per year. Forestry companies who have earned or have been gifted NZU’s are able to pay off their liabilities with ERUs and make instant profits. The scheme is currently dysfunctional because it is rife with people making money for nothing and with speculative hoarding of NZUs, thereby lowering credit prices to such an extent that we New Zealanders are not pulling our weight in global climate change mitigation.
“What we need to do in order to fix our scheme is:
1) Stop all imports of credits.
2) Disallow ERUs within our ETS, and allow New Zealanders with ERUs to sell them back on the international market.
3) Stop grandfathering credits.
4) Cease random, ‘fiscally neutral’ gifting from Government to selected companies and individuals.
5) Apply the ETS equally and fairly to all sectors, including agriculture.
6) Allow trading only between sequesterers and emitters (if you over-pollute you pay someone else to clean up).
7) Manage our domestic NZU ‘currency’ in a similar way to the Reserve Bank’s management of our coinage. This could be achieved by setting reduction targets each year in response to NZU market conditions, requiring surrenders only for ‘over target’ GHG emissions, and ensuring that annual targets stabilised the NZU price at an effective level.
“For more, fully referenced, peer-reviewed information about why New Zealand’s ETS has failed, see here.”